 impossible to dry, was of poor quality, or was a total loss.
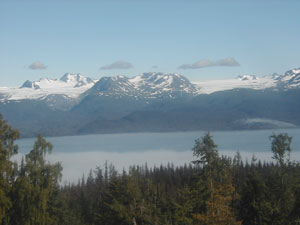
The Schade Family has been harvesting grass for hay for over 40 years on their ranch, located 15 miles East of Homer, Alaska. The elevation ranges from 600 feet to 1750 feet above sea level. The weather is the most critical part of this operation and most years the hay loses value due to it’s largely unpredictable nature. The biggest losses have been from waiting well past the hay’s prime for a long enough drying time to complete the operation and get it successfully under cover. When we guessed wrong (looking at the sky or feeling it in our bones) it resulted in wet hay that was difficult to impossible to dry, was of poor quality, or was a total loss.
In order to beat this problem we tried adding chemicals, artificial drying using forced heated air, silage, haylage and bagging the hay. All of these methods were too expensive or too time consuming, or both. As with many other grass farmers, we did organize a system of natural drying the grass in two or three days. This system generally consists of cutting early in the grass plant growth period, tedding the hay immediately, wind rowing it in the evening, opening the row back up the next morning, and finally bailing when adequately dry. This takes very little additional labor and helps ones chances of producing good hay tremendously.
The time for cutting grass hay is very important. In the past we would be out cutting the grass when it should have already been down and in the process of drying. (This error in timing can cost you a full day drying time). For the most part, we have 24 hour daylight during haying season but from 10 p.m. to 2 a.m. the grass does not dry much. For the best advantage our rule is to cut at the end of a storm no matter what time of the day.
There are many additional factors in making good hay. The type of machinery used, and the method of use, type and care of the hay bales and how the hay is handled and stored. The above conditions vary for each farmer so one must work with what one has and do the best we can.
The more accurately we use it for our purposes the better. For the past two years we have been using a computer weather system for this purpose, and have had significant success. Last year the women of the family harvested over 150 acres of grass with only minor rain damage. Our weather history indicates it  was one of the wettest summers we have had for years, therefore we consider this past summer a good test. The computer weather system we have implemented is not a cure all but it does take out MOST of the guess work. The following outlines the process we use on the computer for a guideline. Hopefully it will be useful to others in the area who, like our family farm, have struggled since inception with the weather’s often unpredictable nature.
Moisture is carried by air masses in our atmosphere. One must understand the movement of these masses in order to calculate what to expect. The high and low air masses carry the moisture. HIGH pressure area is CLOCKWISE and OUTWARD; LOW pressure area is COUNTERCLOCKWISE and INWARD. Keep in mind which side of the pressure area your location is on at any given time and if the weather front is coming from land or sea.
Air masses coming from land tend to be dryer as moisture has been dropped, and the air coming from the sea (water) will be wetter as they have already picked up moisture. Even a portion of the pressure area will have an effect on these conditions. Generally in Alaska, the pressure areas move from the WEST to the EAST and from the SOUTH to the NORTH.
We use the following information in the order provided. You may use it as a guide and develop your own system which you are most comfortable with.
NATIONAL WEATHER SERVICE, ALASKA REGION located on the web at HTTP://www.Alaska.net/~nwsar/. We have book marked this location in order to save time on our major source of weather tracking and information. Our Handy Links Guide lists all our weather related bookmarks.
TELEVISION WEATHER IMAGES (These are the same ones that are presented on KAKM at 5:30 p.m. daily). TV Weather Images
These images are the opinion of NOAA personnel. They are reasonably accurate and should be used as one of the guidelines. These images indicate how fast area weather systems are moving and the direction of their movement. Legends of symbols are given and one needs to be familiar with their purpose in order to make informed decisions. The television images give you an opinion for two days in advance.
SATELLITE IMAGES (Based on Zulu (UTC) time). This time is always ahead of us so you have to subtract nine hours during standard time and eight during daylight time. The NWSFO TIME WHEEL makes it easier to figure. While there are a number of satellite images displayed, we primarily use two. The first one is GOES Infrared Image of Alaska, located at 58N,157W, Size 600 x 480. Note date and time. Homer is located just left of the - 10 line (straight down and below the second circle line). The 1280 x 1024 size image shows a clear picture but does not give the overall view as well. Remember air movement here is generally West to East movement.
The second satellite image we use most frequently is the GMS imagery for the Pacific and Alaska. This imagery indicates the future weather as it comes from Japan to the Aleutian Chain (upper right hand corner). This will show what is coming one to two weeks from the present date.
Two other images show Homer’s location and can be used to check weather. The Mosaic Image of Alaska, which is comprised of four passes and the Image of Alaska, centered at 58N, 155W. Homer’s location there is 59.63N, 151.60W. Occasionally, one or another satellite photo does not come in and another is required for analysis. Approximately the first of June we start watching the movement trends every day, morning and evening to start tracking the weather. Once a day a printout may be taken and added to the previous day’s printout for a cross check.
This unit has a number of sites for review and analysis. For an explanation of the symbols used in the AAWU products go to the Symbols Glossary. After bringing up this unit go to GRAPHIC PRODUCTS. THEN check the HOURLY WEATHER DEPICTION CHARTS for the weather locally and out West and South of your location. Three locations pretty well cover what one wants. Choose the charts that work best for your area.
We use COOK INLET-SUSITNA VALLEY for local weather. SOUTH CENTRAL ALASKA for more general weather and SOUTHWEST to get an indication of what is coming. The Red IFR generally indicates heavy rain or fog. Blue MVFR generally indicates light and variable rain and VFR indicates clear skies or high clouds. Interpreting Surface Observation Symbols from the University of Illinois will help you read the charts.
The direction and velocity of the wind is important as this indicates where the Station is located in the air mass and how intense the air movement is. The wind will be blowing from the flag toward the Station. Each flag is 10 knots and 1/2 flag of course is 5 knots. Watch the dew point in relation to the temperature. The closer together they are, the more moisture in the air which reduces its drying capacity. Real close designates rain.
The images based on the current area forecasts are the next advisory indication of coming weather. Remember the IFR-MVFR-VFR consideration we had on the Station Section. Here we can pull the general area as well and compare or confirm our ideas of the future.
The SURFACE MAP shows the current weather at the time shown. (Z is the same as UTC). This also shows the highs and lows and as we already know the air movement we can determine what will be coming. To confirm this we can pull up the 24 HOUR FORECAST and the 36 HOUR FORECAST as determined by the professionals. Be sure to check their time frame as it can be up to 12 hours off from current time. The time lapse accounts for when they are drawing the charts for their presentation.
The UPPER LEVEL WIND ALOFT IMAGES are important to show the speed and direction of the air masses which will be affecting the haying operation. I generally pull up the 850MB (About 5000’ level winds) first. This gives me an idea of the overall direction of the wind and its velocity. It locates the pressure areas and where they are centered. This area also helps to indicate the wind condition on the water when I want to go fishing. We are totally controlled by these air masses when trying to make hay. The air mass coming from the land will be dryer and will therefore pick up more moisture from the grass. The air masses coming from the sea will be wetter and will not pick up as much moisture. They may also bring rain.
NOAA & AAWU are constantly improving their computer advisory system.. In the past we did not have the following systems but I feel these will help us in the future.
Aresource we have not had in the past is the RADAR SECTION. It is located in the AAWU web site under OBSERVATIONS AND OTHER PRODUCTS. The radar data for Anchorage under Base Reflectivity can be pulled up. Information is also available for Fairbanks and Middleton Island. This image shows the precipitation for the general area. Observe to the west and south for the intensity of what is coming. The degree of air mass density and it’s intensity will help to inform you as to the degree of drying time that will be needed for the grass. These images are sometimes not available so if you do not get what you need try back later.
The professionals that developed the weather system are continually improving it. If you work and study this system for your everyday needs such as fishing trips (very important) winter travel, snow removal, planting, flying, etc. you will pick up the general trends and key points to bookmark and review. When time is critical, print off the satellite or radar image every 12 hours and post them so you can understand progress. The more one uses it the more confidence one gets.
Anchorage weather is not our weather and one must redirect the information for the location you want. Summer weather is easier to predict than winter as the flow of the air masses are much more consistent. We are still guessing the weather, and always will be, but the use of technology driven, computer enhanced information allows us to make a more educated guess of when to harvest grass hay for optimum drying and ultimate forage quality.
E-mail for further information
Return to Home | Weather | Alaska Homesteading | Rural Neighbors